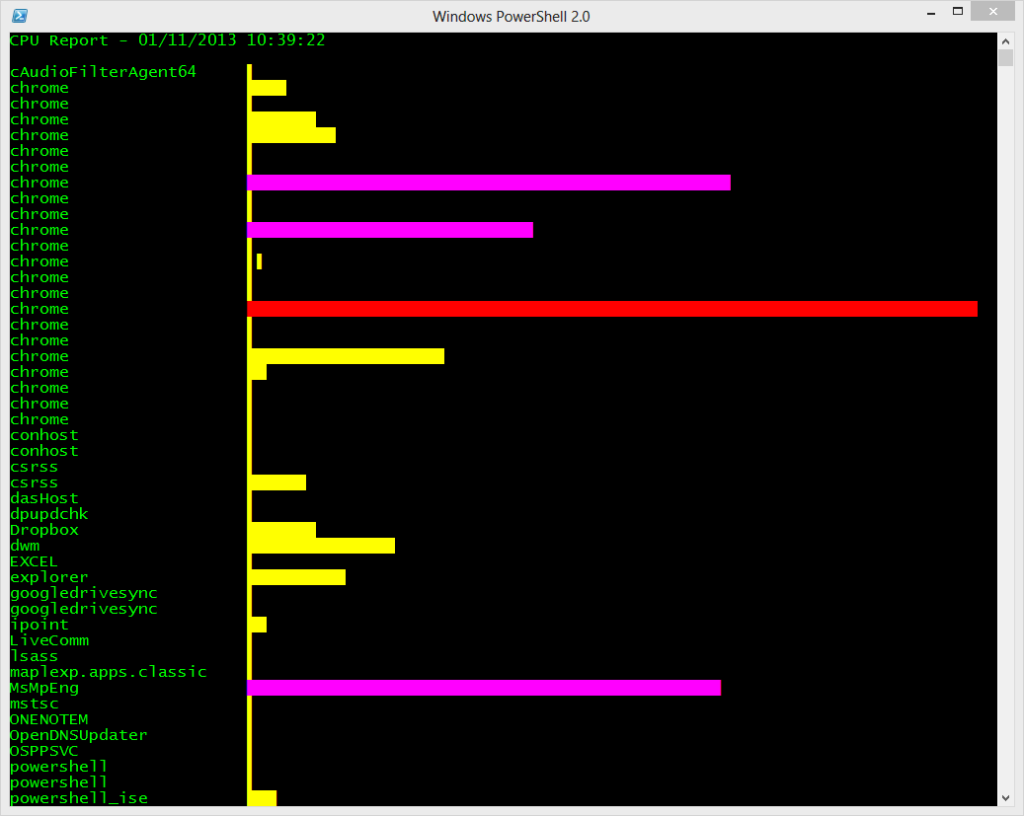
Many of you have been having fun with my PowerShell Console Graphing tool I posted the other day. But I felt the need to make one more major tweak. I wanted to have the option for conditional formatting. That is, display graphed entries with high values in one color, medium in another and low in yet another.
ManageEngine ADManager Plus - Download Free Trial
Exclusive offer on ADManager Plus for US and UK regions. Claim now!
The default behavior is still to use a single color. But using ParameterSets I added some new parameters, -HighColor, -MediumColor and -LowColor. They are all mandatory so if you use one parameter you have to define them all.
[cmdletbinding(DefaultParameterSetName="Single")]
Param (
[parameter(Position=0,Mandatory=$True,HelpMessage="Enter a property name to graph")]
[ValidateNotNullorEmpty()]
[string]$Property,
[parameter(Position=1,ValueFromPipeline=$True)]
[object]$Inputobject,
[string]$CaptionProperty="Name",
[string]$Title="$Property Report - $(Get-Date)",
[Parameter(ParameterSetName="Single")]
[ValidateNotNullorEmpty()]
[System.ConsoleColor]$DefaultColor="Green",
[Parameter(ParameterSetName="Conditional",Mandatory=$True)]
[ValidateNotNullorEmpty()]
[System.ConsoleColor]$HighColor,
[Parameter(ParameterSetName="Conditional",Mandatory=$True)]
[ValidateNotNullorEmpty()]
[System.ConsoleColor]$MediumColor,
[Parameter(ParameterSetName="Conditional",Mandatory=$True)]
[ValidateNotNullorEmpty()]
[System.ConsoleColor]$LowColor,
[alias("cls")]
[switch]$ClearScreen
)
I also moved the Property parameter and made it positional which should make it easier to use. The conditional coloring works basically by taking the largest possible graph value, which is based on available screen width and dividing it into thirds. The top third is considered high, second third is medium and last third is low.
...
#get remaining available window width, dividing by 100 to get a
#proportional width. Subtract 4 to add a little margin.
$available = ($width-$longest-4)/100
Write-Verbose "Available value is $available"

#calculate high, medium and low ranges based on available
$HighValue = ($available*100) * 0.6666
$MediumValue = ($available*100) * 0.3333
#low values will be 1 to $MediumValue
Write-Verbose "High value will be $HighValue"
Write-Verbose "Medium value will be $MediumValue"
...
When it comes time to graph, I check which parameter set we're using and set the graph color accordingly.
...
if ($pscmdlet.ParameterSetName -eq "Single") {
    $GraphColor = $DefaultColor
}
else {
    #using conditional coloring based on value of $graph
    if ($Graph -ge $HighValue) {
        $GraphColor = $HighColor
    }
    elseif ($graph -ge $MediumValue) {
        $GraphColor = $MediumColor
    }
    else {
        $GraphColor = $LowColor
    }
}
Write-Host ($g*$graph) -ForegroundColor $GraphColor
...
But now I can run a command like this:
PS Scripts:\> ps | where {$_.cpu} | out-consolegraph CPU -high Red -medium magenta -low yellow -cls
What do you think? Download Out-ConsoleGraph-v2.
UPDATE: A newer version is available at https://jdhitsolutions.com/blog/2013/12/updated-console-graphing-in-powershell/


I made a slight change based on feedback from Lee Holmes. If you pipe a collection of objects that don’t share the same property, this will fail. The download link has been updated to load version 1.2 of the function.