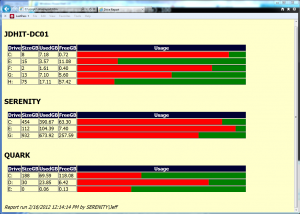
I saw a very nice mention on Twitter today where someone had taken an idea of mine and created something practical and in production. It is always nice to hear. The inspiring article was something I worked up that showed using the PowerShell console as a graphing tool. Of course someone immediately wanted to know about turning this into HTML. Actually he wanted this in a web page that would automatically refresh. I don't think I can manage that, but I came up with a demo script that will create a colorized bar graph in ah HTML page. If you want to update it, simply re-run your command.
ManageEngine ADManager Plus - Download Free Trial
Exclusive offer on ADManager Plus for US and UK regions. Claim now!
Here's the demo code.
#requires -version 2.0
Param (
[string[]]$computers=@($env:computername),
[string]$Path="drivereport.htm"
)
$Title="Drive Report"
#embed a stylesheet in the html header
$head = @"
"@
#define an array for html fragments
$fragments=@()
#get the drive data
$data=get-wmiobject -Class Win32_logicaldisk -filter "drivetype=3" -computer $computers
#group data by computername
$groups=$Data | Group-Object -Property SystemName
#this is the graph character
[string]$g=[char]9608
#create html fragments for each computer
#iterate through each group object
ForEach ($computer in $groups) {
$fragments+="
$($computer.Name)
" #define a collection of drives from the group object
$Drives=$computer.group
#create an html fragment

    $html=$drives | Select @{Name="Drive";Expression={$_.DeviceID}},

    @{Name="SizeGB";Expression={$_.Size/1GB  -as [int]}},

    @{Name="UsedGB";Expression={"{0:N2}" -f (($_.Size - $_.Freespace)/1GB) }},

    @{Name="FreeGB";Expression={"{0:N2}" -f ($_.FreeSpace/1GB) }},

    @{Name="Usage";Expression={

      $UsedPer= (($_.Size - $_.Freespace)/$_.Size)*100

      $UsedGraph=$g * ($UsedPer/2)

      $FreeGraph=$g* ((100-$UsedPer)/2)

      #I'm using place holders for the < and > characters

      "xopenFont color=Redxclose{0}xopen/FontxclosexopenFont Color=Greenxclose{1}xopen/fontxclose" -f $usedGraph,$FreeGraph

    }} | ConvertTo-Html -Fragment
    #replace the tag place holders. It is a hack but it works.

    $html=$html -replace "xopen","<"
    $html=$html -replace "xclose",">"
#add to fragments
$Fragments+=$html
#insert a return between each computer
$fragments+="
"
} #foreach computer
#add a footer
$footer=("
Report run {0} by {1}\{2}" -f (Get-Date -displayhint date),$env:userdomain,$env:username)
$fragments+=$footer
#write the result to a file
ConvertTo-Html -head $head -body $fragments | Out-File $Path
The key concept here is that I'm building a final HTML file from a collection of HTML fragments. I think most of the script should be self-explanatory. The core part of the script takes the collection of drives for a computer, selects some custom properties and converts it into an HTML fragment.
#create an html fragment
$html=$drives | Select @{Name="Drive";Expression={$_.DeviceID}},
@{Name="SizeGB";Expression={$_.Size/1GB -as [int]}},
@{Name="UsedGB";Expression={"{0:N2}" -f (($_.Size - $_.Freespace)/1GB) }},
@{Name="FreeGB";Expression={"{0:N2}" -f ($_.FreeSpace/1GB) }},
@{Name="Usage";Expression={
$UsedPer= (($_.Size - $_.Freespace)/$_.Size)*100
$UsedGraph=$g * ($UsedPer/2)
$FreeGraph=$g* ((100-$UsedPer)/2)
#I'm using place holders for the < and > characters
"xopenFont color=Redxclose{0}xopen/FontxclosexopenFont Color=Greenxclose{1}xopen/fontxclose" -f $usedGraph,$FreeGraph
}} | ConvertTo-Html -Fragment
The tricky part is the value for "Usage" In the Expression scriptblock I'm calculating a value for how much disk space is used and how much is free. I then create a string that is my graphing character ([CHAR]9608) times a value. The value is the corresponding percentage divided by 2 because I want to put the used graphic right next to the free graphic. And this leads me to the hack: I want the used graph to be in Red and the free graph string to be in Green. I'm taking the easy way and using a FONT tag. But, I can't use the < and > characters because Convertto-HTML "translates" them. I couldn't find anyway around this. So instead I use a place holder.
"xopenFont color=Redxclose{0}xopen/FontxclosexopenFont Color=Greenxclose{1}xopen/fontxclose" -f $usedGraph,$FreeGraph
All I need to do is replace the placeholders from the HTML output.
#replace the tag place holders. It is a hack but it works.
$html=$html -replace "xopen","<"
$html=$html -replace "xclose",">"
#add to fragments
$Fragments+=$html
Perhaps not the most elegant solution, but it works. The script wraps up by taking all of the HTML code and creates the final file.
ConvertTo-Html -head $head -body $fragments | Out-File $Path
To run this for a group of computers I can run a command like:
PS C:\scripts> .\demo-HtmlBarChart.ps1 "jdhit-dc01","serenity","quark"
I haven't found a way to make this process more generic and my script, while it works, isn't really production ready; that's why I call it a demo script. But perhaps you'll take inspiration and come up with some wonderful. If you do, I hope you'll let me know and share with the PowerShell community.
Download Demo-HtmlBarChart.


Nice one Jeffery 🙂
Keep it up 😀
This is great! I can already think of more than one place I could use this idea.