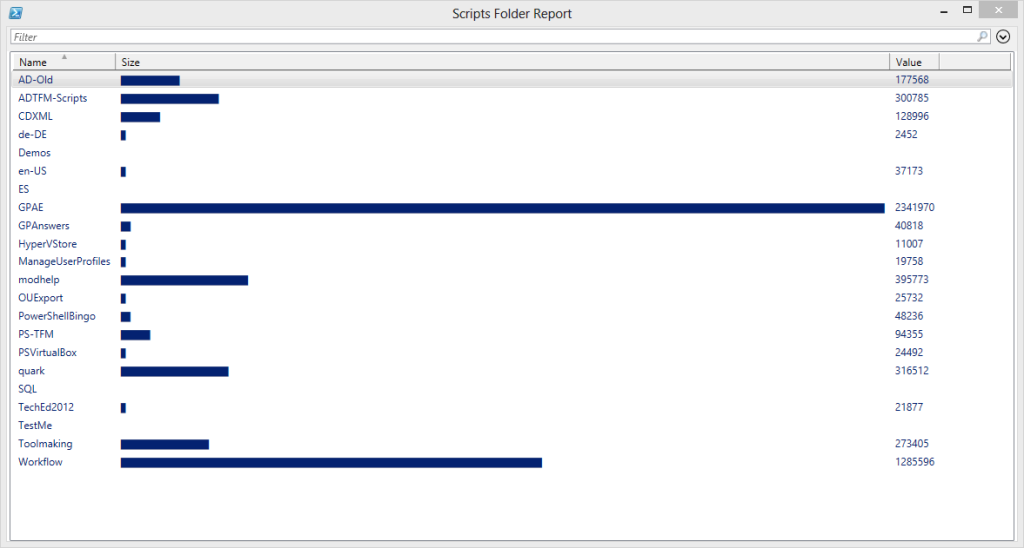
I've received a lot of interest for my last few posts on graphing with the PowerShell console. But I decided I could add one more feature. Technically it might have made more sense to turn this into a separate function, but I decided to simply modify the last version of Out-ConsoleGraph. The new version adds a switch parameter called -Gridview. When used, the graphing information is sent to the Out-Gridview cmdlet. This version will require PowerShell 3.0 as I'll explain.
ManageEngine ADManager Plus - Download Free Trial
Exclusive offer on ADManager Plus for US and UK regions. Claim now!
I realized I could just as easily send the values for the object name, property and graphing figure to Out-Gridview. In the ForEach construct where each object is processed, if the -GridView parameter is specified, I'll create an ordered hash table and add it to an array.
...

if ($GridView) {

    #add each object to the gridview data array

    $gvHash = [ordered]@{

    $CaptionProperty = $caption

    $Property = ($g*$graph)

    Value = $obj.$Property

    }

    $gvData += New-Object -TypeName PSObject -Property $gvHash

}

...
I need an ordered hash table so that the property values remain in the same order. I could have piped the new object to Select-Object and specified the order, but hopefully many of you are moving to v3 anyway. There's no need for me to pad the caption since the grid view lines things up in columns automatically. It is also easier to add a property with the actual property value. I wanted to incorporate that value into the console version, but it proved to be more complicated than expected. Using Out-Gridview is a nice alternative.
After all of the objects have been processed, if there is anything in $gvData, I send it Out-Gridview.
...

if ($gvData) {

      Write-Verbose "Sending data to Out-Gridview"

      $gvData | Out-GridView -Title $Title

    }

...
When using the grid, there is no way to specify color. But on the other hand, it is much easier to click on a column heading and re-sort. Here's a command I ran with the new function.
Get-ChildItem C:\Scripts -Directory | foreach {

  $data = Get-ChildItem $_.FullName -Recurse -File | Measure-Object -Property Length -sum

  $_ | Select Name,@{Name="Size";Expression={$data.sum}}

} | Out-ConsoleGraph -Property Size -Title "Scripts Folder Report" -grid
Now I have a tool with some flexibility. Although you might also be interested in this article from last November on building a drive report graph also using Out-Gridview.
I bumped the latest version of Out-Consolegraph to 3.0 to align it with the file name. Download Out-ConsoleGraph-v3


Nice. In V3, from there you could also select items from the graph to return detail about.
I thought about that. But you’ll only get what is displayed. So if I’m displaying say a process name, a graph value for the workingset and the working set value, there’s probably not much I can do with that. I’d have to wrap the Out-consoleGraph command to take the passed objects and find them again.
I know. That’s pretty much what I had to do with the Select-Item script…cache the original objects, create a display, and then pass the original objects based on the display selection. It gets complicated.
Thanks for sharing this useful script with us.
I´m a big fan of Windows PowerShell and I like to expand my knowledge in this case.
So I look forward the read your good and great article.