The other day Distinguished Engineer and PowerShell Godfather Jeffrey Snover posted a blog article about the evils of Write-Host. His take, which many agree with, is that Write-Host is a special case cmdlet. In his article he mentions console graphing as an example. I wrote such a script earlier this year. Mr. Snover's post drove some new attention to my post and I realized it needed a little polishing.
Here is a revised version of that script.
#requires -version 3.0

Function Out-ConsoleGraph {

<#
.Synopsis
Create a console-based chart
.Description
This command takes objects and creates a horizontal bar graph based on the
property you specify. The property should return a numeric value. This command
does NOT write anything to the pipeline. All output is to the PowerShell host.

The default behavior is to use the same color, Green, for all graphed values.
But you can specify conditional coloring using -HighColor, -MediumColor and
-LowColor. If you specify one you must specify all three. The maximum available
graph value is divided into thirds. The top third will be considered high, the
next third medium and the rest low.

The final option is to send the graph results to Out-Gridview. But, you cannot
use conditional formatting nor specify a graph color. However, the grid view will
include the property value.

This command should work in both the Windows PowerShell console and PowerShell
ISE. There is no guarantee it will work with any other PowerShell host.

.Parameter Property
The name of the property to graph.
.Parameter CaptionProperty
The name of the property to use as the caption. The default is Name.
.Parameter Title
A string for the title of your graph. The default is <Property> Report - <date>
.Parameter DefaultColor
The default console color to use for the graph
.Parameter HighColor
The console color to use for the top 1/3 of graphed values.
.Parameter MediumColor
The console color to use for the middle 1/3 of graphed values.
.Parameter LowColor
The console color to use for the bottom 1/3 of graphed values.
.Parameter ClearScreen
Clear the screen before displaying the graph. The parameter has an alias of cls.
.Parameter GridView
Create a graph using Out-Gridview. The parameter has an alias of ogv
.Example
PS C:\> Get-Process | Out-ConsoleGraph -property WorkingSet -clearscreen
.Example
PS C:\> $computer=$env:computername
PS C:\> Get-CimInstance Win32_logicaldisk -filter "drivetype=3" -computer $computer |
out-ConsoleGraph -property Freespace -Title "FreeSpace Report for $computer on $(Get-Date)"

This example assumes the computer has more than one logical disk.
.Example
PS C:\> get-vm | where state -eq 'running' | out-consolegraph -Property MemoryAssigned -GraphColor Red

Get all running virtual machines using the Hyper-V Get-VM cmdlet and display a graph
depicting MemoryAssigned.
.Example
PS C:\> "chi-dc01","chi-dc02","chi-dc04","chi-fp02" | foreach -Begin {cls} {
  $computer=$_
  Get-CimInstance win32_logicaldisk -filter "deviceID='C:'" -ComputerName $computer |
  Select Caption,PSComputername, @{Name="PercentFree";Expression={ [int](($_.FreeSpace/$_.Size)*100)}}
  } |  Out-ConsoleGraph -property PercentFree -title "Freespace Report - $(Get-Date)" -CaptionProperty PSComputername -HighColor DarkGreen -MediumColor White -LowColor Red

This example will create a console graph showing percent free space on Drive C: for several computers.
.Example
PS C:\> get-process | where {$_.cpu} | out-consolegraph CPU -high Red -medium magenta -low yellow
.Example
PS C:\> get-process | where {$_.cpu} | out-consolegraph CPU -high Red -medium magenta -low yellow -verbose 4>&1>verb.txt

Run the previous example to create a conditional color chart and send verbose data to a text file.
.Example
PS C:\> get-process | where {$_.cpu} | Sort CPU -descending | Out-Consolegraph CPU -Caption ID -Grid

Very similar to previous example except output is to Out-Gridview and the process ID is
displayed instead of the process name.
.Example
PS Scripts:\> (dir *.txt).where{$_.length -gt 50KB} | ocg length

This is a PowerShell 4.0 example that will create a console graph for all .txt
files in the Scripts folder greater than 50KB in size. this example is using the
optional ocg alias for Out-ConsoleGraph.
.Example
PS C:\> $PSDefaultParameterValues.Add("Out-ConsoleGraph:HighColor","Red")
PS C:\> $PSDefaultParameterValues.Add("Out-ConsoleGraph:MediumColor","Yellow")
PS C:\> $PSDefaultParameterValues.Add("Out-ConsoleGraph:LowColor","Green")
PS C:\> (dir c:\scripts\*.txt).where{$_.length -gt 50KB} | Add-member -membertype Aliasproperty -Name Size -value Length -passthru | ocg Size -Title "C:\Scripts Text Report $((Get-Date).ToShortDateString())"

This command creates default parameter values for conditional colors so you don't
have to specify them. It also creates an alias property of Size for the Length
property and uses that instead.  The .Where syntax requires PowerShell 4.0.

.Link
Write-Host
Out-Gridview
.Link
https://jdhitsolutions.com/blog/2013/12/updated-console-graphing-in-powershell
.Inputs
Object
.Outputs
None
.Notes

Version:  3.1
Updated:  12/9/2013
Author :  Jeffery Hicks (https://jdhitsolutions.com/blog)

Discover and Learn PowerShell:
 -> Learn Windows PowerShell 3 in a Month of Lunches
 -> Learn PowerShell Toolmaking in a Month of Lunches
 -> PowerShell in Depth: An Administrator's Guide
 -> PowerShell Deep Dives


#>

[cmdletbinding(DefaultParameterSetName="Single")]

Param (
[parameter(Position=0,Mandatory=$True,HelpMessage="Enter a property name to graph")]
[ValidateNotNullorEmpty()]
[string]$Property,
[parameter(Position=1,ValueFromPipeline=$True)]
[object]$Inputobject,
[string]$CaptionProperty="Name",
[string]$Title="$Property Report - $(Get-Date)",
[Parameter(ParameterSetName="Single")]
[ValidateNotNullorEmpty()]
[Alias("graphColor")]
[System.ConsoleColor]$DefaultColor="Green",
[Parameter(ParameterSetName="Conditional",Mandatory=$True)]
[ValidateNotNullorEmpty()]
[System.ConsoleColor]$HighColor,
[Parameter(ParameterSetName="Conditional",Mandatory=$True)]
[ValidateNotNullorEmpty()]
[System.ConsoleColor]$MediumColor,
[Parameter(ParameterSetName="Conditional",Mandatory=$True)]
[ValidateNotNullorEmpty()]
[System.ConsoleColor]$LowColor,
[alias("cls")]
[switch]$ClearScreen,
[Parameter(ParameterSetName="Grid")]
[Alias("ogv")]
[switch]$GridView
)

Begin {
    Set-StrictMode -Version latest

    Write-Verbose -Message "Starting $($MyInvocation.Mycommand)"
    Write-Verbose -Message "Parameter set $($pscmdlet.ParameterSetName)"

    #get the current window width so that our lines will be proportional
    $Width = $Host.UI.RawUI.BufferSize.Width
    Write-Verbose "Width = $Width"

    #initialize an array to hold data. We will process all the data at the end.
    $data=@()
    if ($pscmdlet.ParameterSetName -eq 'Grid') {
        Write-Verbose "Initializing gvData"
        $gvData = @()
    }
} #begin

Process {
    #get the data from the pipelined input and add it to the array
    $data += $Inputobject

} #end process

End {
    #get largest property value
    Write-Verbose "Getting largest value for $property"
    Try {
       <#
       Modified this original line per Lee Holmes to handle piped objects that
       might not have the same property such as Directory and File.
       $largest = $data | sort $property | Select -ExpandProperty $property -last 1 -ErrorAction Stop
       #>
       $largest = $data | Foreach-Object { $_.$property } | Sort-Object | Select-Object -last 1
        Write-Verbose $largest
    }
    Catch {
        Write-Warning "Failed to find property $property"
        #bail out of the command
        Return
    }
    If ($largest) {
        #get length of longest object property used for the caption so we can pad
        #This must be a string so we can get the length
        Write-Verbose "Getting longest value for $CaptionProperty"
        $sample = $data |
        Sort-object -Property @{Expression={($_.$CaptionProperty -as [string]).Length}} |
        Select-Object -last 1

        Write-Verbose ($sample | out-string)
        [int]$longest = ($sample.$CaptionProperty).ToString().length

        Write-Verbose "Longest caption is $longest"

        #get remaining available window width, dividing by 100 to get a
        #proportional width. Subtract 4 to add a little margin.
        $available = ($width-$longest-4)/100
        Write-Verbose "Available value is $available"

        #calculate high, medium and low ranges based on available
        $HighValue = ($available*100) * 0.6666
        $MediumValue = ($available*100) * 0.3333
        #low values will be 1 to $MediumValue
        Write-Verbose "High value will be $HighValue"
        Write-Verbose "Medium value will be $MediumValue"

        if ($ClearScreen) {
            Clear-Host
        }
        Write-Host "`n$Title`n"
        foreach ($obj in $data) {
            #define the caption
            [string]$caption = $obj.$captionProperty

            <#
             calculate the current property as a percentage of the largest
             property in the set. Then multiply by the remaining window width
            #>
            if ($obj.$property -eq 0) {
                #if property is actually 0 then don't display anything for the graph
                [int]$graph=0
            }
            else {
                $graph = (($obj.$property)/$largest)*100*$available
            }
            if ($graph -ge 2) {
                [string]$g=[char]9608
            }
            elseif ($graph -gt 0 -AND $graph -le 1) {
                #if graph value is >0 and <1 then use a short graph character
                [string]$g=[char]9612
                #adjust the value so something will be displayed
                $graph=1
            }

            Write-Verbose "Graph value is $graph"
            Write-Verbose "Property value is $($obj.$property)"

            #send to Out-Gridview if specified
            if ($pscmdlet.ParameterSetName -eq "Grid") {
                #add each object to the gridview data array
                $gvHash = [ordered]@{
                $CaptionProperty = $caption
                $Property = ($g*$graph)
                Value = $obj.$Property
                }
                $gvData += New-Object -TypeName PSObject -Property $gvHash
            }
            Else {
                Write-Host $caption.PadRight($longest) -NoNewline
                #add some padding between the caption and the graph
                Write-Host "  " -NoNewline
                if ($pscmdlet.ParameterSetName -eq "Single") {
                    $GraphColor = $DefaultColor
                }
                else {
                    #using conditional coloring based on value of $graph
                    if ($Graph -ge $HighValue) {
                        $GraphColor = $HighColor
                    }
                    elseif ($graph -ge $MediumValue) {
                        $GraphColor = $MediumColor
                    }
                    else {
                        $GraphColor = $LowColor
                    }
                } #else console

                Write-Host ($g*$graph) -ForegroundColor $GraphColor
            } #not gridview
        } #foreach
           #add a blank line
           Write-Host `n
    } #if $largest

    if ($pscmdlet.ParameterSetName -eq "Grid") {
      Write-Verbose "Sending data to Out-Gridview"
      $gvData | Out-GridView -Title $Title
    }
    Write-Verbose -Message "Ending $($MyInvocation.Mycommand)"
} #end

} #end Out-ConsoleGraph

#define an optional alias
Set-Alias -Name ocg -Value Out-ConsoleGraph
I didn't make too many structural changes other than to add Set-StrictMode and revise some of my IF statements to test for ParameterSetName instead of a variable. Using StrictMode, which is a good thing, caused problems in my earlier version. I also went through and added some new examples, including a few PowerShell 4.0.
The function still requires at least PowerShell 3.0. But it allows you to do something like this:
$computers = "chi-dc01","chi-dc02","chi-dc04","chi-fp02","chi-core01.globomantics.local","chi-app01"
$computers | foreach -Begin {cls} {
  $computer=$_
  Get-CimInstance win32_logicaldisk -filter "deviceID='C:'" -ComputerName $computer |
  Select Caption,SystemName, @{Name="PercentFree";Expression={ [int](($_.FreeSpace/$_.Size)*100)}}
  } |  Out-ConsoleGraph -property PercentFree -title "Globomantics Freespace Report - $((Get-Date).ToShortDateString())" -CaptionProperty SystemName -HighColor DarkGreen -MediumColor magenta -LowColor Red
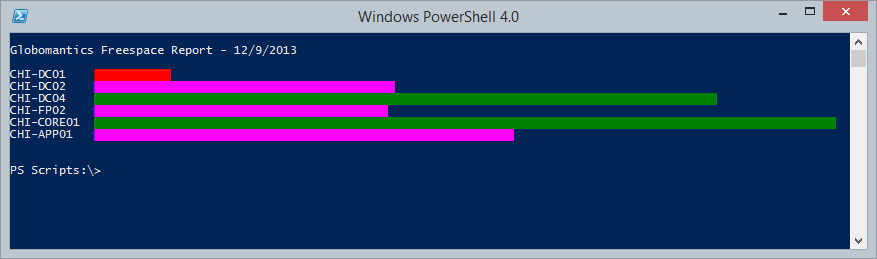
All you can do is look at this but sometimes, that's all you need.
Love this. It worked for me, but I did get an error “The variable ‘$g’ cannot be retrieved because it has not been set.”. I haven’t had time to investigate it yet. Thanks!
Ah, there’s just no case for when $graph value is 0.
$G is the character used in the graph. So I guess if the graph value is 0 there’s nothing to display. I probably didn’t test with anything that had a 0 value.