Windows Powershell makes it relatively easy to collect performance counter information via the Get-Counter cmdlet. Because I'm assuming you want to collect more than a few seconds of performance information, you'll need to take advantage of PowerShell background jobs if you want your prompt back. Of course, you can always open a second session, but I like the background job approach. Here's how I've been experimenting with this.
ManageEngine ADManager Plus - Download Free Trial
Exclusive offer on ADManager Plus for US and UK regions. Claim now!
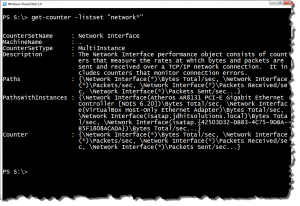
For my test, I wanted to capture network interface information; specifically the counters bytes received/sec, bytes sent/sec and bytes totla/sec. But I only wanted them for my primary interface. To discover the counter names, use the -ListSet parameter with Get-Counter.
[cc lang="PowerShell"]
PS S:\> get-counter -listset "network*"
[/cc]
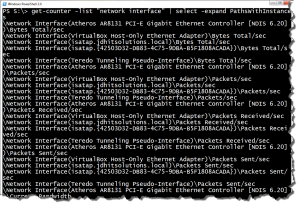
The standard counters would include all interfaces, but I would prefer to limit my query to a specific interface. But what are they?
[cc lang="PowerShell"]
PS S:\> get-counter -list "network interface" | select -expand PathsWithInstances
[/cc]
The interface I want has Atheros in the name, so let's filter.
[cc lang="PowerShell"]
PS S:\> get-counter -list "network interface" | select -expand PathsWithInstances | where {$_ -like "*atheros*bytes*"}
[/cc]
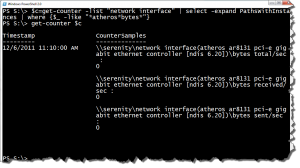
Now I know the counters I want. I'll do a quick test to verify.
[cc lang="PowerShell"]
PS S:\> $c=get-counter -list "network interface" | select -expand PathsWithInstances | where {$_ -like "*atheros*bytes*"}
PS S:\> get-counter $c
[/cc]
I'm not concerned about the 0 values. I know that when I start collecting there will be data. I'm also running this against the local machine. The better approach with performance monitoring is to gather data from a remote machine. But that is easy enough to do by using the -Computername parameter. For now, I'll keep testing locally. Of course, make sure you get the right instance from the remote machine.
Now I can begin using Get-Counter. There are a number of parameters to control how long I gather data. I'm going to use -Continuous. I'll use Start-Job to kick off my data collection.
[cc lang="PowerShell"]
$sb={
$c=get-counter -list "network interface" | select -expand PathsWithInstances | where {$_ -like "*atheros*bytes*"}
Get-counter -Counter $c -continuous
}
Start-Job $sb
[/cc]
When I'm finished collecting, I can use Stop-Job to terminate, then receive the job results.
[cc lang="PowerShell"]
PS C:\> stop-job 2
PS C:\> $data=Receive-job 2 -keep
[/cc]
The $data variable contains all of the performance data. I might want to save it to a file if I plan on opening it later in the performance monitor management console.
[cc lang="PowerShell"]
PS C:\> $data | export-counter e:\nicdata.csv -fileformat CSV
[/cc]
However, if you try that it will fail. Here's why. The results that come from the job are of the type Deserialized.Microsoft.PowerShell.Commands.GetCounter.PerformanceCounterSampleSet and Export-Counter doesn't know what to do with that. You could use Export-CSV, but I think the better approach is to include the export command as part of your job. Here's my revised scriptblock.
[cc lang="PowerShell"]
$sb={
$c=get-counter -list "network interface" | select -expand PathsWithInstances | where {$_ -like "*atheros*bytes*"}
Get-counter -Counter $c -continuous | Export-Counter -FileFormat CSV -Path e:\temp\nic2.csv
}
[/cc]
Again, I can start the job and stop it when I'm done collecting. There really isn't any need to receive the results because everything I want is in the CSV file. I can import the CSV file into PowerShell using Import-CSV, load it in the Performance Counter management console, or open in Microsoft Excel and build a PivotTable report.
If you'd like to learn more about gathering performance data or managing other aspects of your server infrastructure with PowerShell, take a look my my video training course from TrainSignal.


