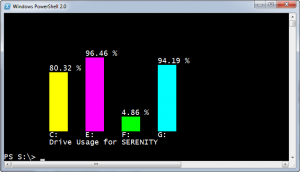
Late last year I posted a demo script to create a horizontal bar graph in the PowerShell console. I liked it and many of you did as well. But I also wanted to be able to create a vertical bar graph, ie one with columns. This is much trickier since you have to tell PowerShell exactly where to "paint" the graph.
ManageEngine ADManager Plus - Download Free Trial
Exclusive offer on ADManager Plus for US and UK regions. Claim now!
I've posted other articles on using the coordinates in the host and that is what I ended up doing for today's Friday Fun. This demo script only works in the PowerShell console. It will run in the ISE but you won't get the desired result. Let me post the code and then I'll go through a few things.
Param([string]$computername=$env:computername)
Clear-Host
#get the data
$drives=Get-WmiObject -Class Win32_LogicalDisk -Filter "drivetype=3" -computername $computername
#define a set of colors for the graphs
$colors=@("Yellow","Magenta","Green","Cyan","Red")
#set cursor position

$Coordinate = New-Object System.Management.Automation.Host.Coordinates

$Coordinate.X= 10

$Coordinate.Y= [int]($host.ui.rawui.WindowSize.Height -5)

#save starting coordinates

$startY=$Coordinate.Y

$startX=$Coordinate.X
#counter for colors
$c=0
#adjust Y so we can write the caption
$Coordinate.Y+=1
foreach ($drive in $drives) {
#set the color to the first color in the array of colors
$color=$colors[$c]
$legend=$drive.DeviceID
#calculate used space value
$used=$Drive.Size - $Drive.FreeSpace
[int]$usedValue=($used/($drive.size))*10
#adjust for values less than 0 so something gets graphed
if ($usedValue -le 0) {
[int]$usedValue=($used/($drive.size))*50
}
#format usage as a percentage
$usedPer="{0:p2}" -f ($used/($drive.size))
#set the cursor to the new coordinates
$host.ui.rawui.CursorPosition=$Coordinate
#write the caption
write-host $legend -nonew
#move the Y coordinate up to start the graph
$coordinate.Y-=1
for ($i=$usedValue;$i -gt 0;$i--) {

      $host.ui.rawui.CursorPosition=$Coordinate

      #draw the color space for the graph

      write-host "    " -BackgroundColor $color -nonewline

      #move Y up 1

      $coordinate.y--

      #repeat until we reach the $usedValue

    }
#set new coordinate
$host.ui.rawui.CursorPosition=$Coordinate
#write the usage percentage at the top of the bar
write-host $usedPer -nonewline
#reset Y to where we started + 1
$Coordinate.Y=($startY+1)
#move X to the right
$coordinate.x+=8
#reset coordinates
$host.ui.rawui.CursorPosition=$Coordinate
#increment the color counter
$c++
#repeat for the next drive
} #foreach
#reset coordinates so we can write a legend
$coordinate.Y=$StartY+2
$coordinate.X=$startX
$host.ui.rawui.CursorPosition=$Coordinate
write-host ("Drive Usage for {0}" -f $drives[0].__SERVER)
#move cursor to bottom of the screen and write a blank line
$Coordinate.X=1
$coordinate.Y=[int]($host.ui.rawui.WindowSize.Height-2)
$host.ui.rawui.CursorPosition=$Coordinate
write-host ""
#your PowerShell prompt will now be displayed
This script gets drive usage and creates a vertical bar chart displaying disk utilization. Everyone loves a good drive space report and they always make good demos.
The script creates a System.Management.Automation.Host.Coordinates object, setting the value of X and Y that should be starting in the bottom left corner of the console.
#set cursor position
$Coordinate = New-Object System.Management.Automation.Host.Coordinates
$Coordinate.X= 10
$Coordinate.Y= [int]($host.ui.rawui.WindowSize.Height -5)
#save starting coordinates
$startY=$Coordinate.Y
$startX=$Coordinate.X
I'm also saving these values so I can reset. The script will have to "move" the cursor around the screen to draw the graphs. Once I calculate the values for each drive, I write a blank line using Write-Host with -Backgroundcolor to get the desired graphing effect.
for ($i=$usedValue;$i -gt 0;$i--) {
$host.ui.rawui.CursorPosition=$Coordinate
#draw the color space for the graph
write-host " " -BackgroundColor $color -nonewline
#move Y up 1
$coordinate.y--
#repeat until we reach the $usedValue
}
Notice after each write I move the Y point "up", until I reach the limit of the current value. I set values as a percentage scaled to 10 so the graph doesn't end up outside of the buffer. I also made an adjustment for low values that wouldn't normally trigger a graph so that I get something written to the screen.
 #calculate used space value

    $used=$Drive.Size - $Drive.FreeSpace

    [int]$usedValue=($used/($drive.size))*10

    #adjust for values less than 0 so something gets graphed

    if ($usedValue -le 0) {

       [int]$usedValue=($used/($drive.size))*50

    }
After drawing the graph I move the cursor position back to the beginning and write a legend.
#reset coordinates so we can write a legend

$coordinate.Y=$StartY+2

$coordinate.X=$startX

$host.ui.rawui.CursorPosition=$Coordinate

write-host ("Drive Usage for {0}" -f $drives[0].__SERVER)
Here's the end result.
This script is really just a proof of concept. I haven't created any functions to simply any of this or make it easy to use with other values. This is also a bit advanced so if you look at this and it makes your head hurt, don't worry about it. You would only use something like this in special cases. Still, I'd like to know what you think, how it works for you and if you extend it to a more re-usable form.
Download demo-bargraph. The script will default to the local computer, but you can run specify any computer you want.
PS C:\Scripts\> .\demo-bargraph.ps1 Mycomputer
Enjoy and have fun.


Is there a reason you don’t use the .Net libraries like this?http://blogs.technet.com/b/richard_macdonald/archive/2009/04/28/3231887.aspx
You can’t show it in the console but it is really easy to create a variety of graphs. I even have scripts that will create some graphs, save them as .png and then create an html page to put them in. It’s fairly easy to make a simple report up this way.
There are plenty of ways to create graphs. I have another post somewhere that creates one in an HTML page. I just wanted to have some fun with the console and see what I could do. The other point of my Friday Fun articles is to demonstrate PowerShell concepts and ideas that someone might pick up on and use somewhere else. Thanks for you comment and link.
I had to add :
if($drive.VolumeName){ }
around everything in the foreach scriptblock to keep from getting an error message. A reboot would probably have fixed this also.