I've written before about using the PowerShell console as a graphing tool, primarily using Write-Host. Most of what I've published before were really proof of concept. I decided to try and come up with a more formal and re-usable tool that could create a horizontal bar graph based on a numeric property from piped objects. For example, I wanted to get all processes and display a graph of the WorkingSet for each object. My result is an advanced function that should work in v2 or v3 called Out-ConsoleGraph.
ManageEngine ADManager Plus - Download Free Trial
Exclusive offer on ADManager Plus for US and UK regions. Claim now!
Here's the code, minus, the comment-based help. I've commented the quote quite a bit so I won't spend a lot of time explaining it in detail.
Function Out-ConsoleGraph {

#comment based help goes here

[cmdletbinding()]
Param (
[parameter(Position=0,ValueFromPipeline=$True)]
[object]$Inputobject,
[parameter(Mandatory=$True,HelpMessage="Enter a property name to graph")]
[ValidateNotNullorEmpty()]
[string]$Property,
[string]$CaptionProperty="Name",
[string]$Title="$Property Report - $(Get-Date)",
[ValidateNotNullorEmpty()]
[System.ConsoleColor]$GraphColor="Green",
[alias("cls")]
[switch]$ClearScreen
)

Begin {
    Write-Verbose -Message "Starting $($MyInvocation.Mycommand)"
    #get the current window width so that our lines will be proportional
    $Width = $Host.UI.RawUI.BufferSize.Width
    Write-Verbose "Width = $Width"

    #initialize an array to hold data
    $data=@()
} #begin

Process {
    #get the data
    $data += $Inputobject

} #end process

End {
    #get largest property value
    Write-Verbose "Getting largest value for $property"
    Try {
        $largest = $data | sort $property | Select -ExpandProperty $property -last 1 -ErrorAction Stop
        Write-Verbose $largest
    }
    Catch {
        Write-Warning "Failed to find property $property"
        Return
    }
    If ($largest) {
        #get length of longest object property used for the caption so we can pad
        #This must be a string so we can get the length
        Write-Verbose "Getting longest value for $CaptionProperty"
        $sample = $data |Sort @{Expression={($_.$CaptionProperty -as [string]).Length}} |
        Select -last 1
        Write-Verbose ($sample | out-string)
        [int]$longest = ($sample.$CaptionProperty).ToString().length
        Write-Verbose "Longest caption is $longest"

        #get remaining available window width, dividing by 100 to get a
        #proportional width. Subtract 4 to add a little margin.
        $available = ($width-$longest-4)/100
        Write-Verbose "Available value is $available"

        if ($ClearScreen) {
            Clear-Host
        }
        Write-Host "$Title`n"
        foreach ($obj in $data) {
            #define the caption
            [string]$caption = $obj.$captionProperty

            <#
             calculate the current property as a percentage of the largest
             property in the set. Then multiply by the remaining window width
            #>
            if ($obj.$property -eq 0) {
                #if property is actually 0 then don't display anything for the graph
                [int]$graph=0
            }
            else {
                $graph = (($obj.$property)/$largest)*100*$available
            }
            if ($graph -ge 2) {
                [string]$g=[char]9608
            }
            elseif ($graph -gt 0 -AND $graph -le 1) {
                #if graph value is >0 and <1 then use a short graph character
                [string]$g=[char]9612
                #adjust the value so something will be displayed
                $graph=1
            }

            Write-Verbose "Graph value is $graph"
            Write-Verbose "Property value is $($obj.$property)"
            Write-Host $caption.PadRight($longest) -NoNewline
            #add some padding between the caption and the graph
            Write-Host "  " -NoNewline
            Write-Host ($g*$graph) -ForegroundColor $GraphColor
        } #foreach
           #add a blank line
           Write-Host `n
    } #if $largest
    Write-Verbose -Message "Ending $($MyInvocation.Mycommand)"
} #end

} #end Out-ConsoleGraph
The function requires that PowerShell be running in STA mode, which shouldn't really be an issue. The intent is that you will be piping objects to the function. You need to specify a property that you want to graph and an object property to use as the label or caption for each object. The default caption is the Name property which seems pretty common. The property you are graphing must have a numeric value. The function's premise is to get the window width, then write the caption and a graph figure using the remaining available width. The function has a bit of code to calculate the longest caption value so that everything lines up and then determines how much space remains for graphing.
The graph is really more of a proportional representation as opposed to actual value. In short, I find the largest property value which essentially becomes the 100% mark. All other values are calculated as percentages and graphed accordingly. This might be easier to understand if you see it in action.
PS Scripts:\> get-process | where {$_.company -notmatch "microsoft"} | out-consolegraph -property WorkingSet -cls
This is getting all non-Microsoft processes and creating a graph of the WorkingSet property.
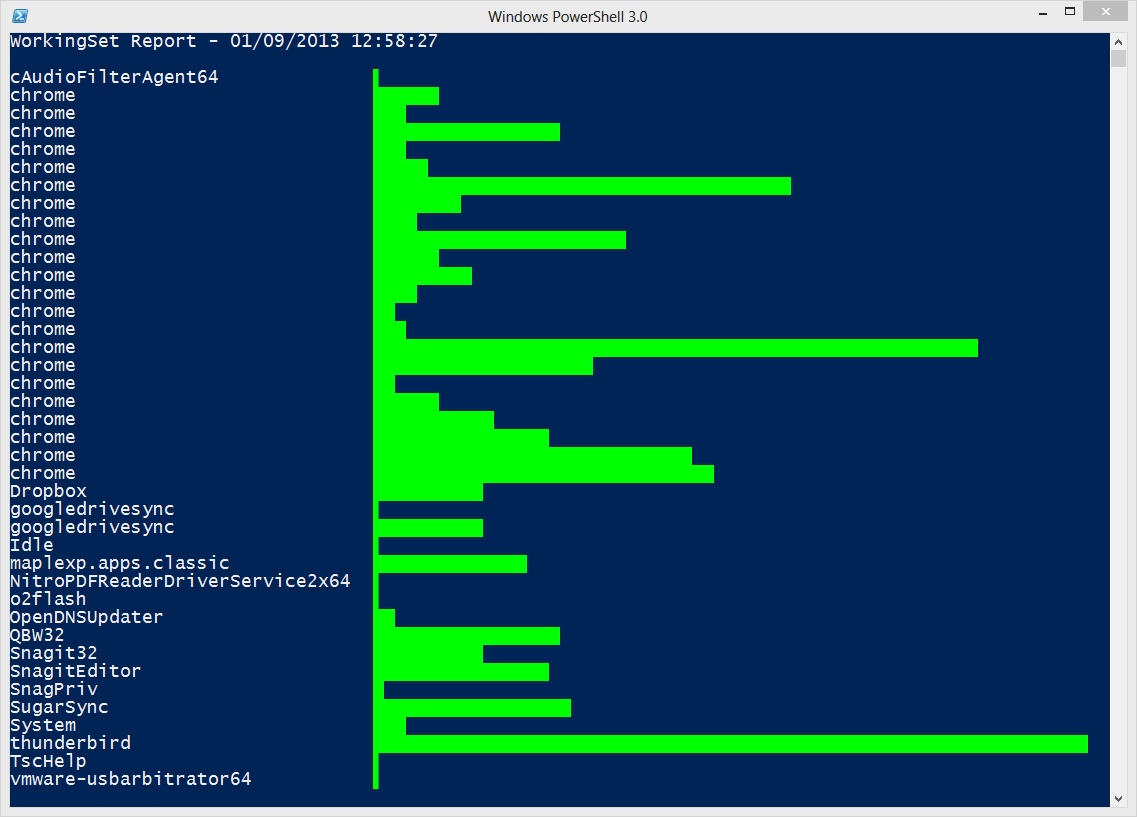
The graph title and color are customizable via parameters. This should work for any type of object as long as you can have a numeric property.
Get-ChildItem C:\Scripts -Directory | foreach {
  $data = Get-ChildItem $_.FullName -Recurse -File | Measure-Object -Property Length -sum
  $_ | Select Name,@{Name="Size";Expression={$data.sum}}
} | Out-ConsoleGraph -Property Size -Title "Scripts Folder Report" -GraphColor Cyan
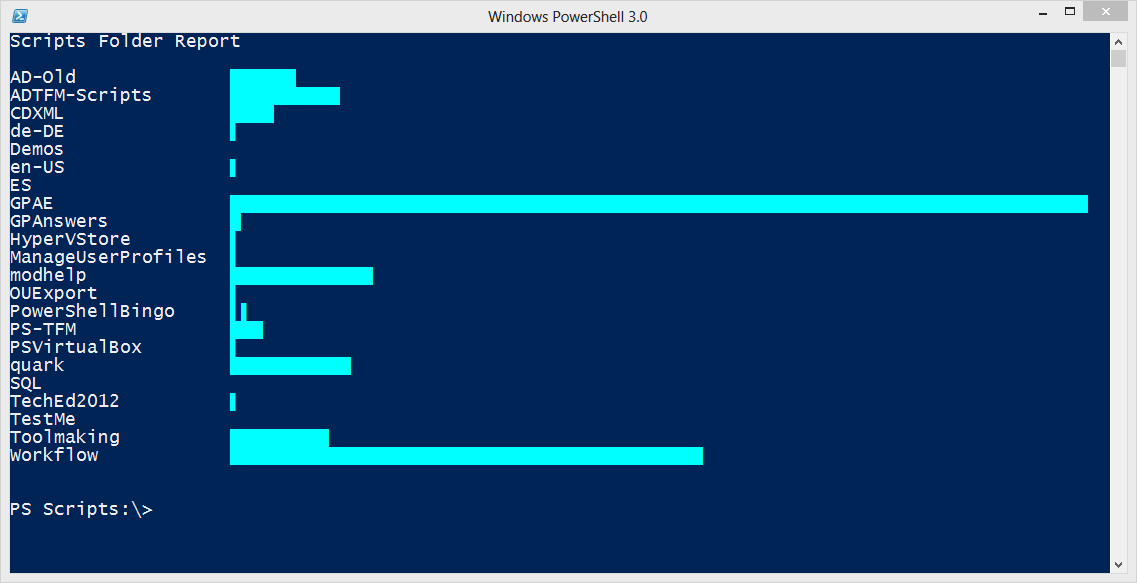
This command will work in the PowerShell ISE but I think it works better in the PowerShell console. Remember, this command is NOT writing to the pipeline so all you can do is view the output.
Download Out-ConsoleGraph and let me know what you think.
I posted an updated version of this tool at http://bit.ly/13mdMyD which includes conditional formatting.