On my last Friday Fun, I posted an article about using Internet Explorer as a trace window. The idea was to put debug or trace messages in a separate application. I received a comment on the post that suggested I could do a similar thing using the Debug View utility from Sysinternals. This application is used to capture debug messages so I thought I'd give it a try.
After you download it, you will run to manually run it once to accept licensing terms and setup a filter. I'm assuming you don't regularly use this program for anything else. Depending on your computer you may not need a filter but it is the best way to work with my Debug-Message function.
#requires -version 2.0

<#
 Requires dbgview.exe from Sysinternals to be in your path or
 modify the function. You should set up a filter in dbview.exe
 before using this to filter on the Category.
#>

Function Debug-Message {

[cmdletbinding()]
Param(
[Parameter(Position=0,Mandatory=$True,HelpMessage="Enter a message")]
[string]$Message,
[string]$Category="PS Trace"
)

#only run if $TraceEnabled is True
if ($script:TraceEnabled) {
    #test if dbgview.exe is already running and start it if not.
    if (-NOT (Get-Process -Name Dbgview -ErrorAction SilentlyContinue)) {
      Try {
        #start with /f to skip filter confirmation prompt
        Start-Process G:\Sysinternals\Dbgview.exe /f
        #give the application to start
        Start-Sleep -Seconds 1
      }
      Catch {
        Write-Warning "Failed to find or start dbgview.exe"
        Return
      }
    } #if dbgview is not running

    #display the message in dbgview.exe
    [System.Diagnostics.Debug]::WriteLine($Message,$Category)

} #if $TraceEnabled

} #close Debug-Message

Set-Alias -Name Trace -Value Debug-Message
The essence of this function is the [System.Diagnostics.Debug]::WriteLine($Message,$Category) line. The Category will show up as a prefix to the message in the Debug View window. I set a filter in Debug View on that category, ie PS Trace*. This function, like my IE trace function, relies on a variable $TraceEnabled to be set to $True. If the dbgview.exe process isn't running, the function starts it. I have hardcoded the path to dbgview.exe which you'll need to adjust. The easiest approach is to drop dbgview.exe into your Windows folder or modify your %PATH% variable to include your Sysinternals folder.
Using the function is no different than my IE version. In fact, in my demo script all I needed to do was change which script gets dot-sourced.
# !!!!!!!!!!!!!!!!!!!!!!!!!!!!!
# dot source the Trace function
#. C:\scripts\Trace.ps1
. C:\scripts\Debug-Message.ps1
# !!!!!!!!!!!!!!!!!!!!!!!!!!!!!
#>
if ($Trace) {
  #set the variable to turn tracing on
  $script:TraceEnabled = $True
}
I added a "Trace" alias to my new Debug View function so don't have to change anything else. When I run my script using the -Trace parameter, I get a handy trace window like this.
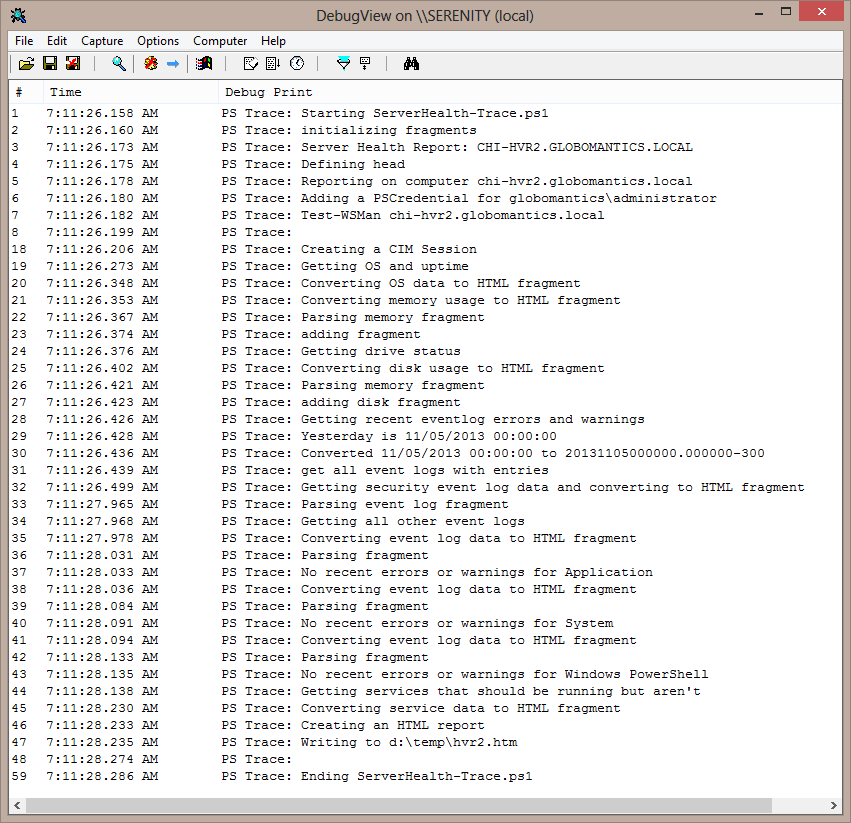
What's handy about this utility is that it is easy to save the results to a file. I also don't have to deal with messy COM objects. If you don't setup the filter ahead of time you may have a hard time finding the trace messages from your script. But that's your choice.
What do you think?